

Two years ago ESA developed and implemented a system that uses the National Hurricane Center's (NHC) disturbance analysis to make forecasts on where the system will move if it were to develop into a cyclone. Last year the algorithm was vastly improved though only a few storms formed to showcase the results. Last Friday at about noon, ESA posted to GOMsmart its first forecast of a tropical disturbance that was then off the Honduran-Nicaraguan border. Based on new NHC data, our forecasts were updated on GOMsmart every 6 hours over the weekend. As of our latest update at 1:00 pm CDT today, it is forecast heading in to the northern Gulf of Mexico, with an estimated 80% chance of becoming the third cyclone this season (the second is now active).
These forecasts occur before the National Hurricane Center (NHC) declares a tropical storm or depression. This work is especially important for advanced planning at the point of weather disturbances. The data can be accessed by clicking on the Storms tab in GOMsmart or by going to "What's New" in GOM3 (the red exclamation point). More information about the algorithm can be found on the GOMsmart Help page (by clicking here).
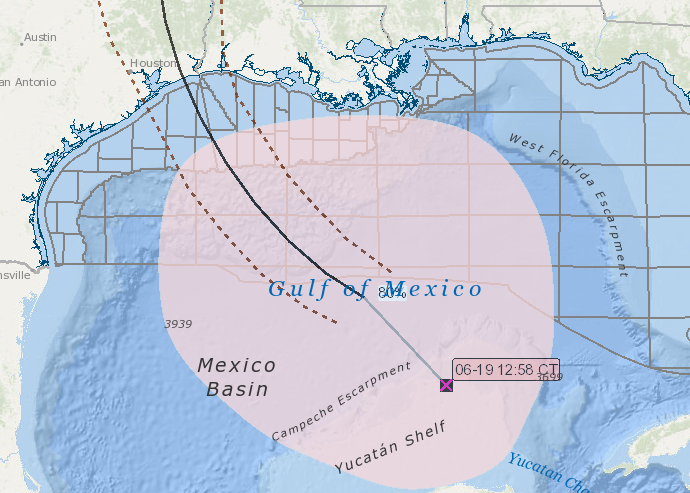
The image below displays the information on this disturbance as of about 1:00PM CDT. The pale red area covers the area that the NHC believes a tropical storm or depression will form within the next five days. The pink X marks the current location of the disturbance, which has just moved offshore from the Yucatan peninsula. The dark black line is the ESA forecast of the best track given the algorithm integrating information on all past storms along with the formation polygon of the NHC and the disturbance location. The dashed lines constrain the 66.67% confidence interval that the potential track will fall within that area.
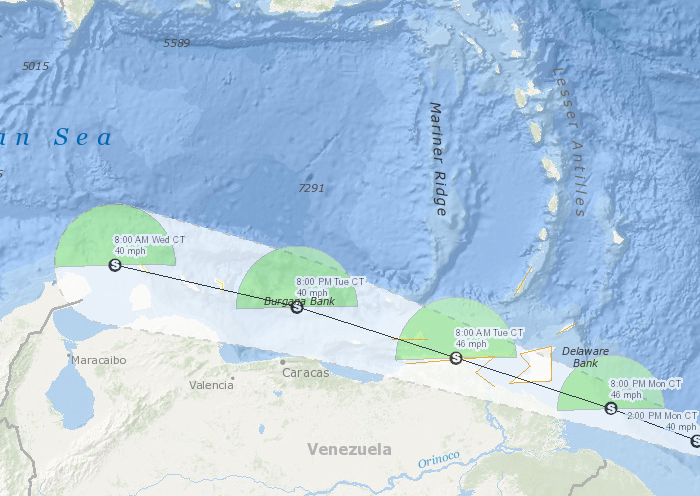
A second disturbance has formed into a potential cyclone (as defined by the NHC) off the northern coast of South America. The image below displays the usual storm strengths, locations, times and forecast cone. ESA also displays the forecast wind radii (green, yellow and red quarters of circles to show 34-, 50- and 64-knot winds). Those wind forecasts are used to predict wind speeds at every platform in the Gulf of Mexico. Each platform can be clicked in the map (or chosen from the GOMsmart main page) to view a graph showing the windspeed at that platform over time. Naturally, no winds from tropical cyclones exist at the platforms at the time of this newsletter.

A quick reminder that the next Analyzing Petroleum Data in the Gulf of Mexico with GOM3 class will be held July 19 at the TeachMeGIS training center in west Houston. An outline of the class is available here (PDF) and registration can be completed at the TeachMeGIS website, www.teachmegis.com.