With the Annual User Conference (Registration and agenda here) rapidly approaching, Earth Science Associates is introducing another component of the Business Planning Add-on to GOM3: Bidding Forecasts. As a reminder, the Business Planning Add-on adds statistical and geographic analysis in various ways, such as the Tie-back tool featured earlier this month.

Three big factors will likely make the Gulf-wide lease sale on March 21 the largest in several years. First is the price of oil: today, WTI comes in just under $64/bbl, where a year ago it was $53 and two years ago, $29. Second, since the price collapse that began in mid-2014, in addition to the 726 leases that expired and 296 that terminated at the end of their production, owners have relinquished a massive number of leases: 2,432. This produced a record number of available blocks. Finally, because of changes last year, the two annual BOEM lease sales are now Gulf-wide.
Responding to our clients’ requests for more analysis of the data in GOM3/GOMsmart, we have developed a set of mathematical models to predict the outcome of upcoming sales. The Bid/No-bid models estimate the probability that each open block will receive a bid. For the most active bidders, this forecast can be disaggregated to the company: what is the probability that ExxonMobil or Hess will bid on a specific block? The second model, Bid Amount, forecasts the highest bid from any company for each open block. Both components are currently limited to deepwater (water depths between 656 and 9,843 feet).

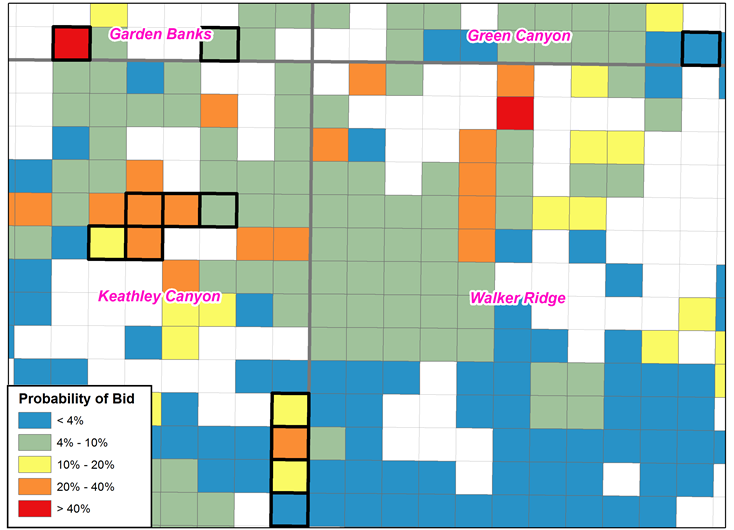
Map shows a forecast of the probability of open blocks receiving at least one bid in the August 2017 sale (leases current at that time are white). The blocks with black outlines actually received at least one bid in that sale. The regression model was used, trained on all sales between 2009 and the March 2017 sale.
The models were "trained" between 2009 and 2017, focusing on block attributes that affect the probability that a block will receive a bid and company preferences evidenced in past sales. To model these effects, we included global explanatory variables (e.g., oil price and its most recent annual change), local variables (e.g., density of wells in the neighborhood of a block) and company-specific parameters (e.g., when forecasting Bid/No-bid for Shell, the density of current Shell leases in each block’s neighborhood). Two different mathematical approaches were used for both Bid/No-bid and Bid Amount: regression and neural network analyses. To help understand the details and verify the models, forecasts can be made for past sales between 2013 and 2017, where the forecasts can be compared with the actual bids and bid amounts
A person working on the March 21 sale will choose Bidding Forecast in the Business Planning section of either GOM3 or GOMsmart, then choose between running the model for a single company or all companies collectively and enter the oil price to be used in the analysis. After a few minutes, the results are emailed back in a zip file, which includes a report of the analysis and shapefile with the Bid/No-bid and Bid Amount forecast statistics. The shapefile can be added to GOM3, containing its other data sets and tools, as well as internal proprietary data used in making bidding decisions.

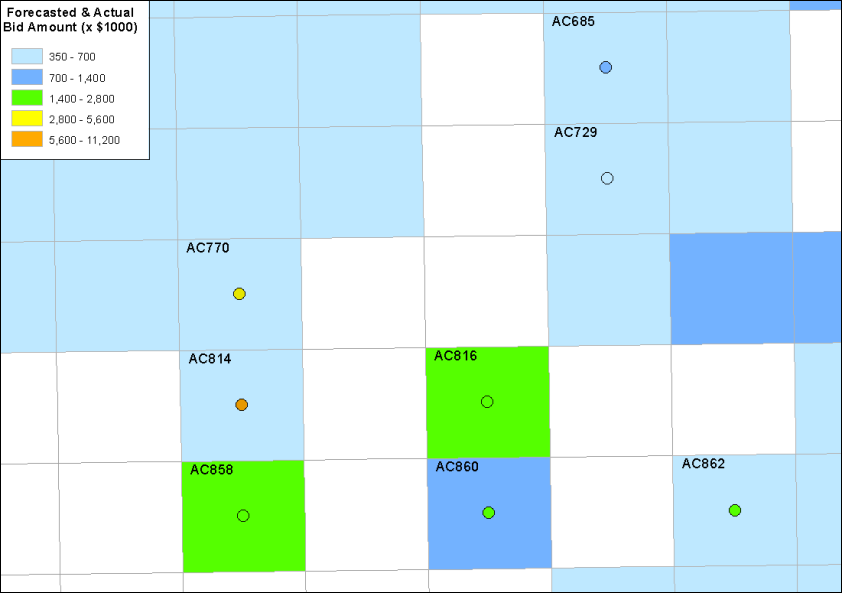
Map shows the forecasted bid amounts for blocks in an area within Alaminos Canyon for the August 2017 sale. The blocks are filled with the color of the forecasted bid amount range shown in the legend and the colored circles appear in blocks receiving bids, with the color in the dot reflecting the actual bid amount class in the legend. Leases current at that time are white.
A presentation on the Bidding Forecasts will be made at the Annual User Conference on February 15 at BHP. We will also introduce both new products, the Business Planning Add-On and the Geophysical Add-On, at our regular annual visits to individual clients this year. To schedule a web presentation on the Bidding Forecast Analysis at your convenience, just contact us at contactesa@earthsci.com.