
The next free webinar, being held on Wednesday, May 18th, is an introduction to the high-end analytics of GOM3 in the Analytics Addon bundle. The Analytics tools maximize efficiency and success in the Gulf of Mexico, gathering the vast resources of GOM3 data to present needed analytics with minimal effort. This is done with both geographic and statistical modeling, elevating GOM3 to another level.
The Analytics Addon bundle includes Drilling Analytics (metrics, forecasts and analogs), Tie-back (and other pipeline) Routing, Lease Sale Forecasts and the Forgotten Oil & Gas Study. Like GOM3, the Addon package is meant to cover a broad swath of usage within your company.
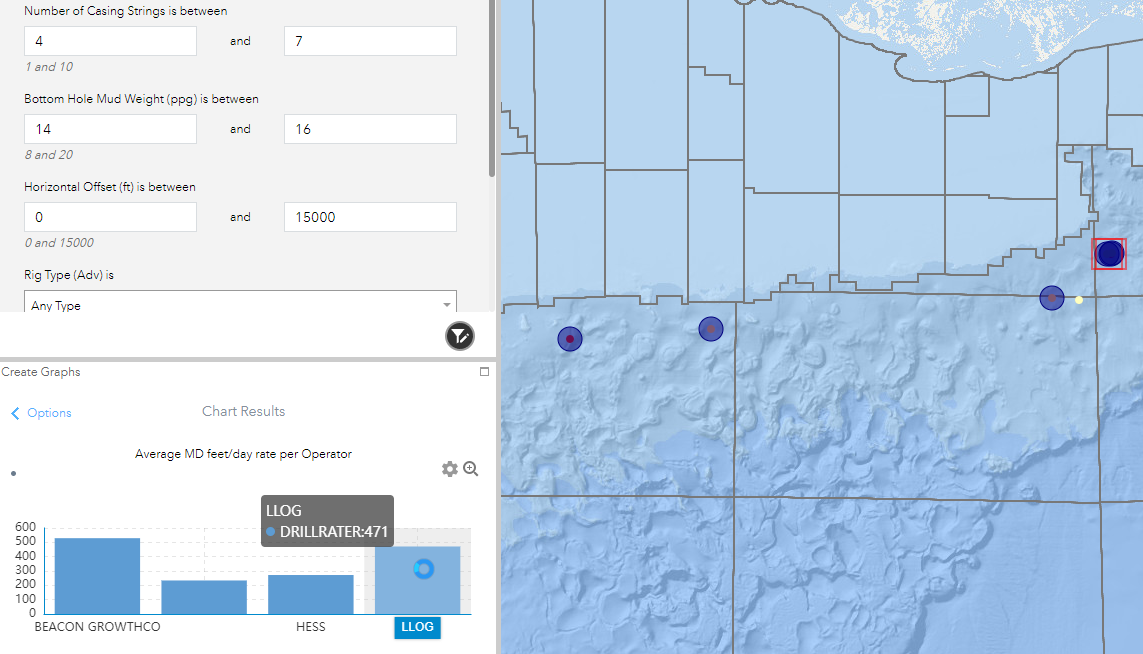
Comparing drilling rates by operator of wells with similar parameters.
This webinar will also introduce the enhanced features of the Geophysical Addon. The Geophysical Addon now includes 3D representations of digital well log data, geomarkers, hydrocarbon-bearing zones and mud weights. And for the first time in GOM3, 3D seismic data, fully dynamic with the ability to quickly slice through the data, is interactive in ArcGIS. This is the system to quickly display well trajectories, perforations, sands, paleo and other vector data with 3D seismic.
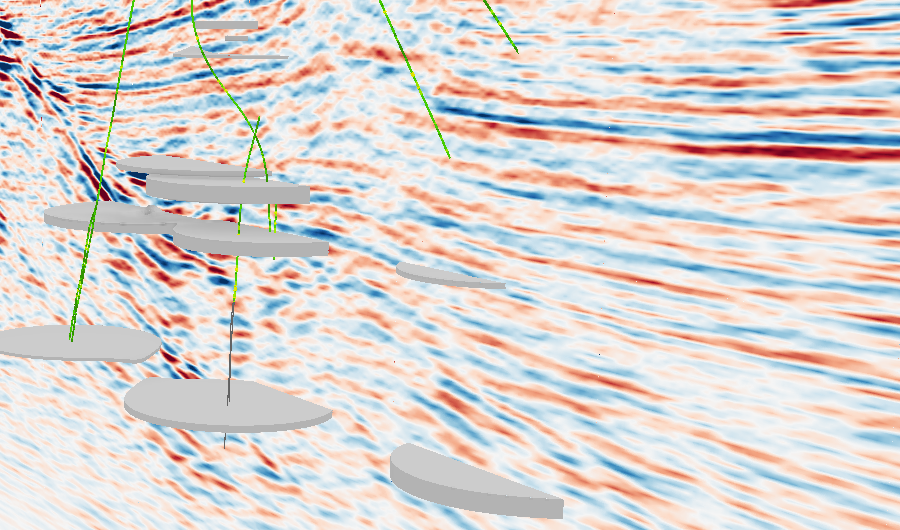
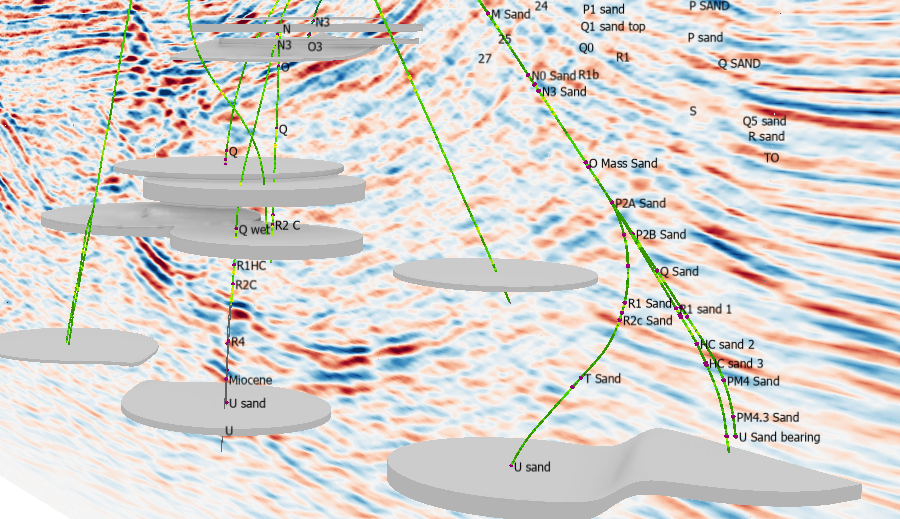
Peeling back 3D seismic data in Auger to show sands, wells (colored by gamma ray values), and labeled geomarkers.
The webinar will be held on Wednesday, May 18th at 1:00 PM CDT. It will be approximately one hour, with extra time for questions. Registration is now available here.
For those interested in learning the quickest way to access loads of GOM information with nothing more than a web browser (even a smartphone's browser), the next GOMsmart webinar will be held Tuesday, June 7th at 2:00 PM CDT. This webinar will go over how the data is put together and processed and is a good way to check out parts of GOMsmart that you may not be currently using. It will also provide a chance to ask questions and offer suggestions. Registration is now available here.
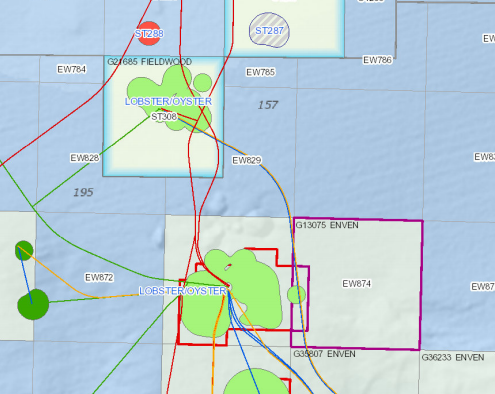
The GOMsmart map shows Current Leases in pale yellow, Units in red outlines, Aliquots in purple outlines and leases with an assignment of operating rights with a blue halo (in the north).
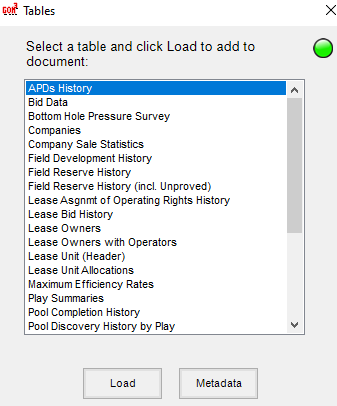
The format of the APD data in ArcGIS has changed slightly. To best represent the data in maps, only the most recent location/information for a permit application is now loaded into the map; essentially, one point per permit. If the historical entries are needed, all permit data is now stored in a separate table on the GOM3 toolbar/ribbon under Tables, as shown here: