


A variety of additions have been made to GOMsmart to streamline your mapping. First and most straightforward, when choosing an item in the Main tab (Block, Lease, Field, Well, Completion, Platform or Pipeline), a new View in Map option will switch to the map and zoom to that feature, such as this one when viewing the King/Horn Mt. field.
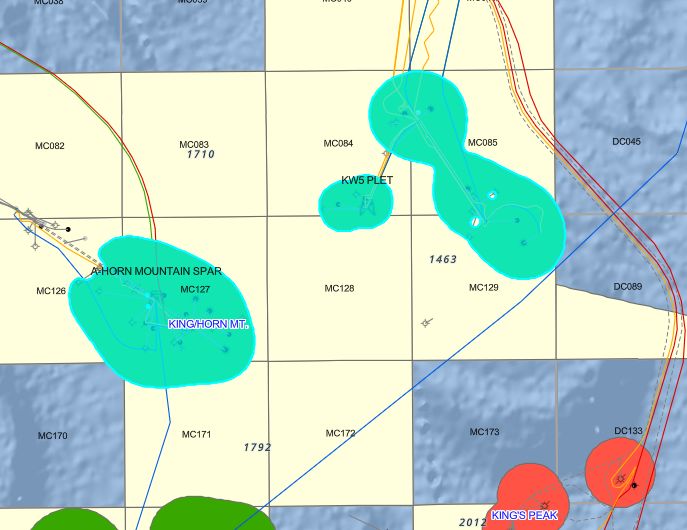 Viewing King/Horn Mt. in SmartMap
Second, when using AskSmart to create a table, the results can be viewed in the map (when mappable). For instance, prompting AskSmart to make a table of Exploratory wells in Green Canyon will create a table of 414 wells. Clicking the Generate Map button (or prompting AskSmart to map the results) will open a map with the returned data.

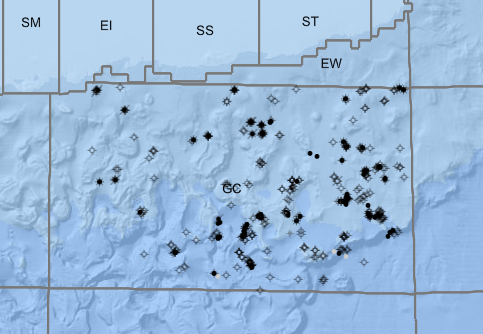 Exploratory wells in Green Canyon
The biggest addition is the Customization at the top of the map, making some preset filters, colors and labels as simple as possible. Each layer in the map can be modified. For instance, with filters you can choose to show only those leases owned by BP, or only the wells with paleo observations.
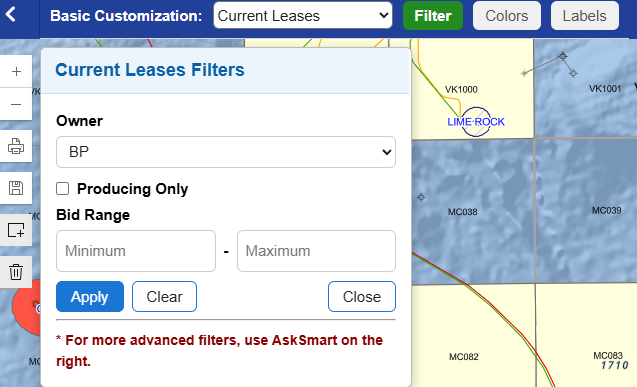 Filtering Leases
Each layer's color can be modified, either to a different single color or a thematic color scheme based on data of the layer. This example changes colors of fields based on the current production.
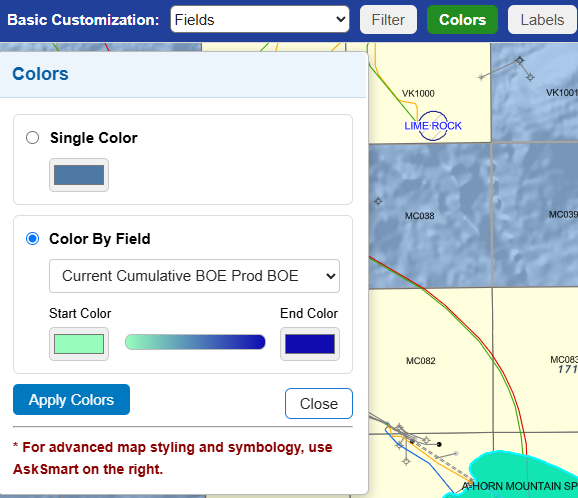 Coloring Fields
Finally, labels can be modified for each layer. This includes complicated labels such as the ones below for leases to choosing any attribute of the data to use. Most importantly, for filters, colors or labels, AskSmart can be used to create more complicated filters and labels and colors for any attribute of each layer.
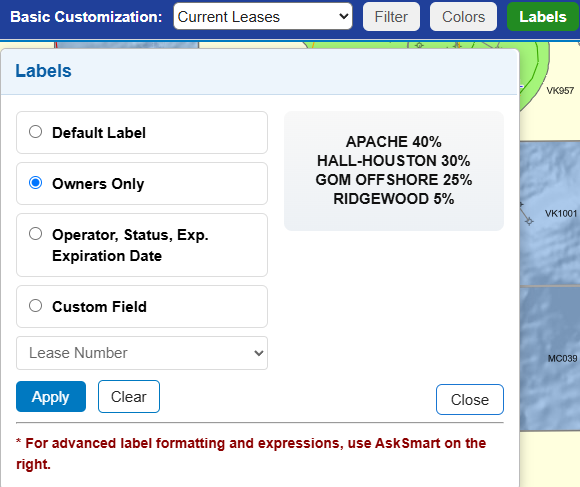 Labeling Current Leases
To learn more about the Smart Map, including sale preparation and saving maps for your specific work, a free webinar is scheduled for Tuesday, Sep. 15th. Click here to learn more.
The next Smart Tiff Viewer webinar will be held Thursday, August 20th at 1:30 PM CDT. Available as part of GOMsmart and GOM3 to all users, it displays image logs for publicly released well logs or your own logs. The webinar covers the tools to calibrate the curves (now including TVD logs), annotate, digitize, add more data (paleo, completions, LAS), and OCR the text.