

GOM3 and GOMsmart have a broad and steadily growing number of engineering applications. The most popular are retrieval and download of data, followed by generation of simple maps. The treasure trove of information includes downloadable monthly oil, gas and water production data, reports, access to BOEM/BSEE documents and production charts for all wells, completions, fields, leases and blocks. This also includes over 280,000 well log images, over 300,000 well test records and weekly drilling reports since 2000.
Data on fields and reservoirs include not only production and EUR but, at the reservoir level, all volumetric information for calculation of oil and gas in-place and recoverable fractions of each. For each field, the history of annual MMS/BOEM reserve estimates since 1975; at the reservoir level, reserve data is for every other year since 1995. Pressure, temperature, condensate yield, number of tests and logs are also accessible on the reservoir level. It should be noted, the reservoir data is available only in the GIS portion of GOM3.
In GOMsmart, most data can be accessed through the tabbed tables that appear on the screen when GOMsmart opens. In addition to feature-specific queries (e.g., a particular well), database searches for many records can be launched through the "Build Reports" button. Through these facilities you can, for instance, create a table of all completions in water depth > 1,000 feet that have a gas-oil ratio under 5 MCF/bbl.
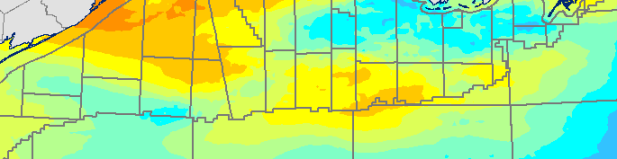
To further enhance the utility of GOM3 and GOMsmart for engineers, two major developments will be introduced in the next two months. First are the maps resulting from ESA's pore pressure prediction project conducted last summer with the Department of Mathematics at California State University Fullerton. Dozens of geostatistically estimated maps, by 1,000-foot depth intervals, will be added for predicted mud weight and pressure gradient.
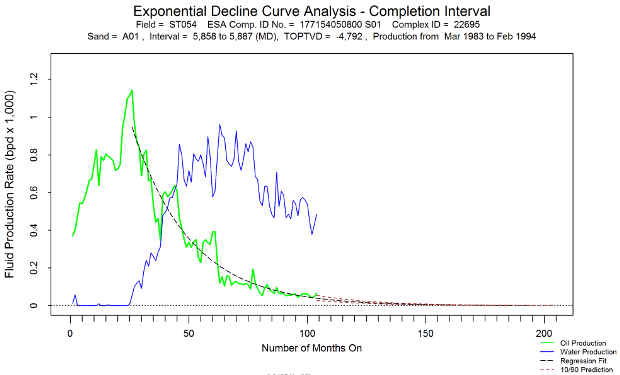
Second is a decline curve tool that will forecast future oil, gas and water production from any completion in the GOM and estimate the remaining hydrocarbons available subject to flow-rate, pressure and water-cut thresholds.