

On March 29, 2023, Sale 259 drew a strong number of traditional bids and continued acquisitions for carbon capture and storage projects. Here we review the Sale 259 forecasts of ESA’s Bidding Model, part of our GOM3 Analytic Addon.
The Bidding Model covers 3,862 deep water blocks. Companies bid on 218 deep water blocks, of which 86% were covered by the Bidding Model analysis. Forecasts were made on the probability each block would receive a bid, a forecasted high bid amount and our predicted MROV (minimum acceptable bid amount). Predictions are based on analysis of 25 lease sales over the last 14 years.
The 16 top bidders over the last 14 years are also analyzed at two levels. First is the estimated likelihood of a company bidding on each block and second is their predicted bid amount. Also, for each major bidder, an analysis shows the impact of key factors affecting its bidding decisions.
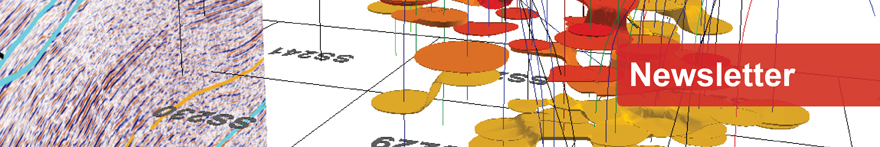
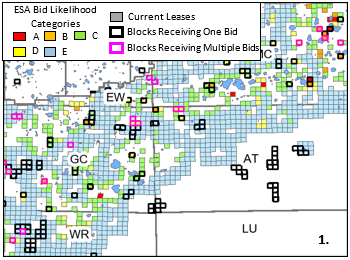
Figure 1 shows the eastern half of the areas bid and Figure 2, the west. All colored blocks were analyzed by the Bidding Model. Block color reflects our evaluation of the probability it will receive one or more bids. Where the probability of being bid was in the highest 5% of the distribution, the block is red (A). For blocks in the 5% - 15% cohort, orange (B); 15% - 30%, yellow (C); 30% - 50%, green (D) and the bottom 50%, blue (E). Blocks that received a single bid in Sale 259 are outlined by a thick black line and those that received more than one bid are outlined in magenta.
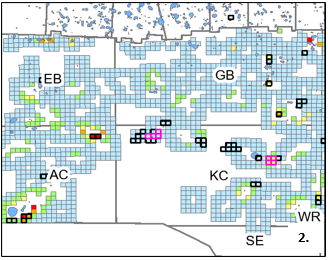
Across the 3,862 blocks evaluated, 51 of those ranked in the top 15% of the distribution by likelihood of being bid (Classes A & B in Figure 3). Of these 42% were actually bid. As expected, some in the lower ranks of probability (Classes C, D, & E) also received bids – but at much lower rates, indicating the model is properly scoring bid likelihood. This analysis is intended to focus attention from the thousands of blocks open to those most likely to be bid and some guidance on who bids where.
The forecasts are not perfect: several of the A blocks that did not receive bids were first-time-available blocks near very productive fields. Such highly-scored blocks are typically picked up.
Several areas produced useful results. The first is in Mississippi Canyon, where several blocks were forecasted as very likely to be bid (Figure 4). MC386 received the highest bid in this area of $2.96 million by Murphy. ESA’s forecasted high bid would be $2.46 million. MC386 drew three other bids from $2.25 million to $0.66 million. Our forecast ranked BP as the company most likely to bid on the block and they did but submitted the lowest bid.
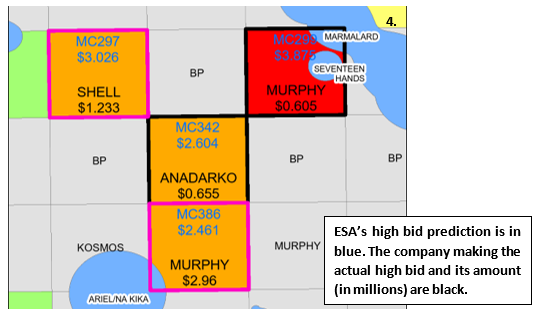
Also in Figure 4, MC299 was in our highest class of being bid (red). It was also bid by Murphy. However, ESA’s estimated high bid at $3.9 million. Murphy only bid $0.6 million - with no competition. A factor in our high forecasted bid amount was that MC343, directly to the south, had been leased for $37 million.
Because our statistical model is built on historical data, we have less confidence moving further into the frontier. At some point, we simply don’t provide forecasts – the white deep water areas in Figures 1 & 2. The blocks analyzed that fell in the bottom half of the distribution of probability of being bid are blue in all maps. They typically have expected bid levels near the MROV.
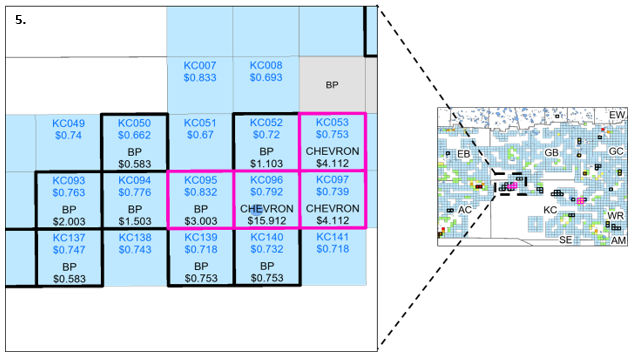
In Figure 5, this group of blocks in Keathley Canyon had bids by BP and Chevron with some competition between the two. The blocks are far from existing infrastructure, with the only nearby field being Gibson on KC096, discovered in 2016 but has no production yet. Our forecast did not recognize the potential of this area, as it is not well informed by the sparse local historical data. However, because of these bids, our evaluation for subsequent sales will rise if these blocks are open.
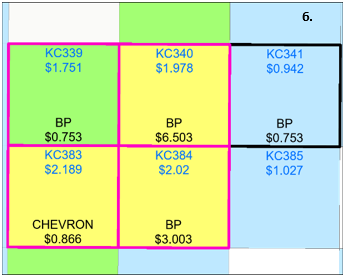
Figure 6 shows another group of competitive blocks in Keathley Canyon. We forecasted that Shell was the most likely company to bid here, which it did. Its bids were around $0.6 million while most of our forecasts were closer to $2 million. In the end, BP and Chevron submitted the highest bids.
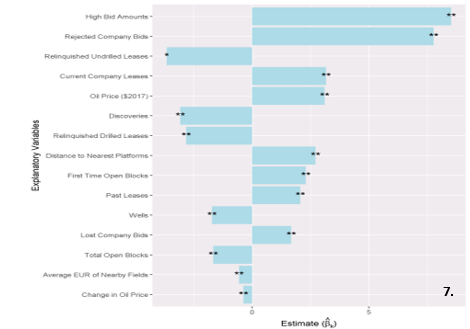
In addition to block level analysis, the Bidding Model provides empirical guidance on company strategies. Figure 7 shows the analysis for one of the highly-active companies over the last decade (the company is omitted for this newsletter). The x-axis measures the positive or negative influence of a host of variables that provide explanatory power for which blocks this company is likely to bid.
Analysis of ESA’s estimates of each block’s MROV will be provided when those data are released by BOEM. The model is now being reset for the September lease sale.
To learn more about the Bidding model and other analytics from the GOM3 Analytics Addon, a number of helpful videos have been created and uploaded to the Earth Science Associates YouTube page. These videos are meant as both an introduction to the data and functionality within GOM3 but also as a deeper dive into some of the more advanced aspects of the statistical models and forecasts.